Step 1: Login to Databricks account
Step 2: You will get “Welcome to databricks” screen
Step 3: Go and create “Cluster”, if it is not running.
(Please see “How to create a new Cluster in Databricks?”
blog for further details)
Step 4: Screenshot of sample Employee CSV file.
Step 5: Click on “Data” and “AddData” button.
Step 6: Click on “Browse” link to choose the CSV file.
Step 7: You will get below screen with selected CSV file.
Step 8: Click on “Create Table in Notebook” button in above
screen. You will get below window.
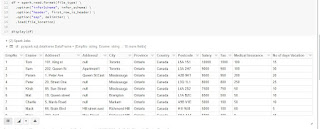
Step 9: Since the first row is header, you need to change ‘
first_row_is_header = ”true” ‘ in the cell as shown below.
Step 10: Click on “Run Cell” to load the data into
databricks.
Key points in above screen are:
First
Row is header
Column
delimiter is comma
Step 11: You will get below screen, with list of records.
The key point is that a Spark Job will be executed to load the data in
databricks environment.
Step 12: Run the below step. It creates temporary table from
the CSV file.
Step 13: In this step, you have switches to “sql” mode and
listing down all records from temp table (EmployeeTable_Sample_csv).
Step 14: Create a permanent table. This format of this table
is “parquet”.
Step 15: I changed the permanent table as “EmployeeTable”.
Please find the below 2 screenshots for your reference.
Step 16: You can use normal Query to find Sum, Average and
other functions.
Step 17: Below query is used for extracting employees who’s Tax
are greater than or equal to 10% of their salary.
Step 18: Without writing code, you can group number of
employees by their vacations. You need to click on Graph => Bar Chart =>
Plot options => Select “Series Grouping” as “NoofDaysVacation”, in “Values”
select “EmpNo” and then in “Aggregation” choose “count”. Click on “Apply”
button to view the plot / graph in the notebook.


No comments:
Post a Comment